Utils Components
Bookmark
In the details section of this component, select a previously created custom bookmark. This component must be fully configured for the "Get Bookmark" and "Update Bookmark" nodes.
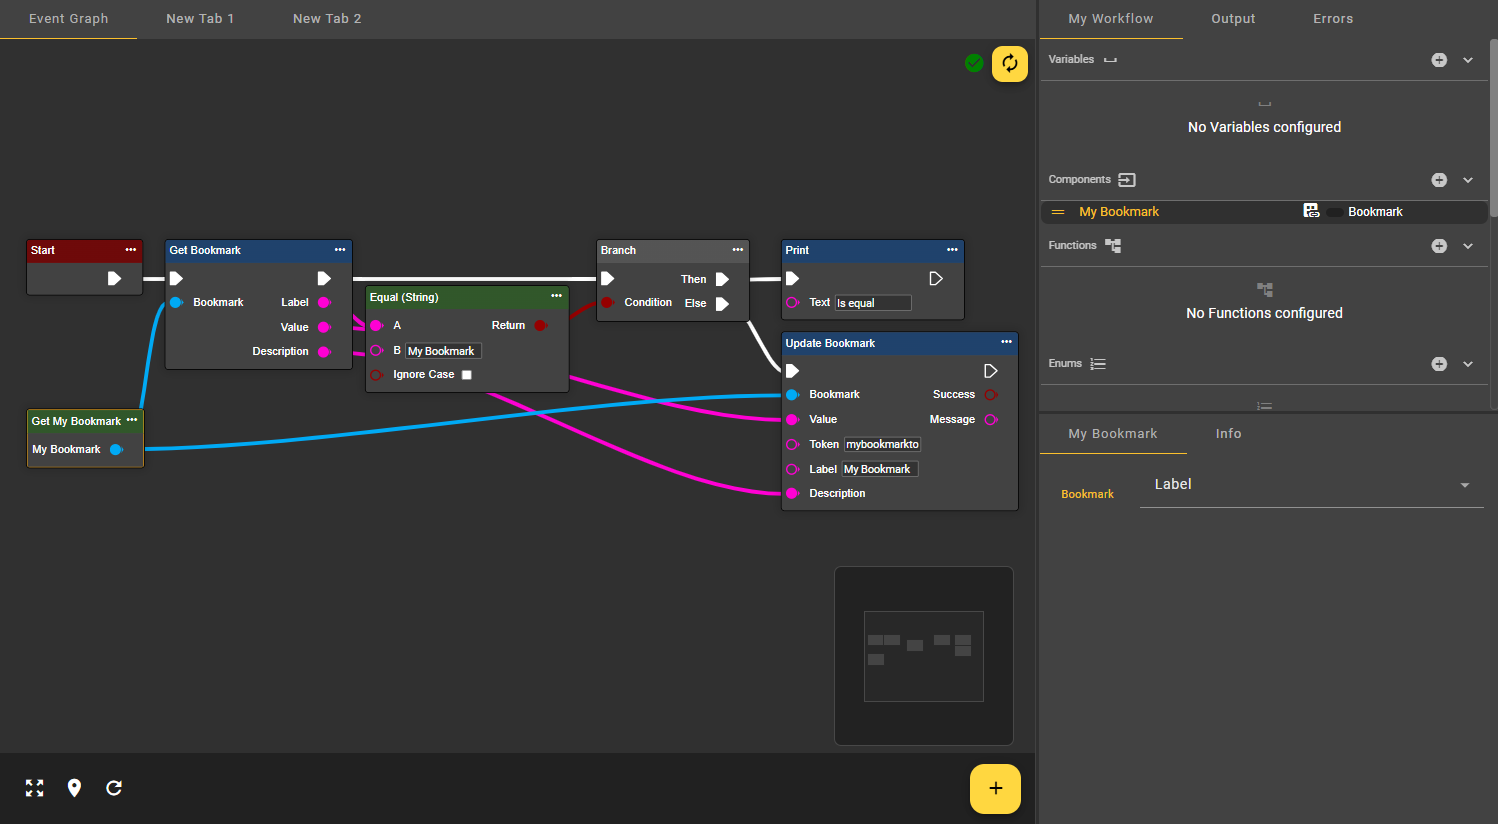
In the following example, a Bookmark Component is created and populated with an existing custom bookmark. This bookmark is selected via the Get My Bookmark node and retrieved via the Get Bookmark node. A check is then performed to see if the existing label matches the comparison string. If it does not, the label is updated via the Update Bookmark node.
Button Event
This component allows you to trigger events with the push of a button. When the workflow is active and the component is used within the workflow, a yellow play button appears in the "My Workflow" area.
Detailed information about the Button Event component can be found here.
CSV
A CSV file is a simple, text-based format that organizes data into rows and columns, using commas as separators.
This component allows you to create a custom CSV file within your workflow. It's ideal for displaying data tables in the output window or sending data to an API endpoint.
In the component settings, select a directory and filename to specify the location of the CSV file. Note: The ".csv" file extension is added automatically. The CSV file can be downloaded from this location.
You can edit your CSV file using the nodes in the "Utils | Table" section. To upload data, navigate to the "Connections" section and locate the CSV file upload nodes.
Attribute | Type | Description | Example |
|---|---|---|---|
Directory | FileStoreDirectory | Select a directory where you want to save your CSV file. |  |
File Name | String | Specify a filename for your CSV file. The file extension ".csv" will be added automatically. | myfile |
Ausführliche Informationen zur CSV Komponente finden Sie hier.
Scheduler
The scheduler can be used as an event within your workflow to trigger nodes at regular intervals, which can be set monthly, daily, hourly, or every minute. You can also select specific days of the week.
To use the scheduler as an event in your workflow, add the "Scheduler" node from the "Events" menu. All nodes connected to this event will trigger at the specified interval.
Special characters | Meaning | Example |
|---|---|---|
* | Any value, such as every minute or every hour. | |
, | Allows for a listing, e.g., the 1st and 15th day. | 1, 15 |
- | Allows you to specify a range, e.g., day 1 to 5. | 1 - 5 |
/ | Specifies a step size, e.g. every 10 minutes. | /10 |
Detailed information about the scheduler component can be found here.
Stopwatch
This component enables the tracking of elapsed time within a workflow. The component itself has no settings of its own. However, the Get node of the Stopwatch component is required for the nodes that will now be explained in more detail.
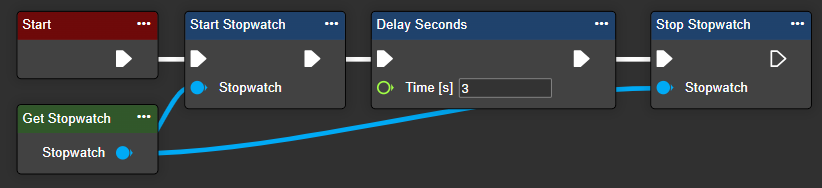
Start Stopwatch
This node can be used to start the stopwatch.
Attribute | Type | Description |
|---|---|---|
Stopwatch | Stopwatch | Requires a Stopwatch component as input, which is provided via the Get node of the Stopwatch component. |
Stop Stopwatch
This node can be used to stop the stopwatch.
Attribute | Type | Description |
|---|---|---|
Stopwatch | Stopwatch | Requires a Stopwatch component as input, which is provided via the Get node of the Stopwatch component. |
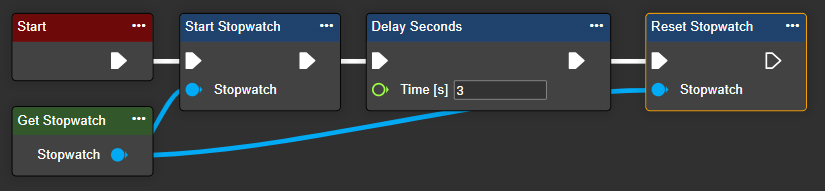
Reset Stopwatch
This node can be used to reset the stopwatch.
Attribute | Type | Description |
|---|---|---|
Stopwatch | Stopwatch | Requires a Stopwatch component as input, which is provided via the Get node of the Stopwatch component. |
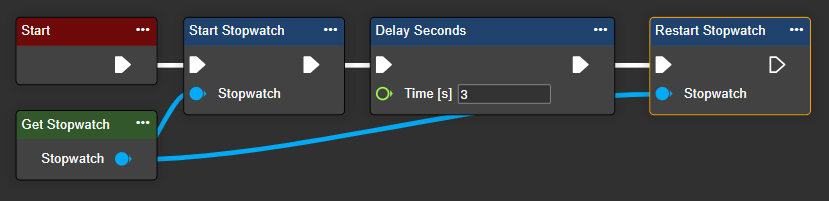
Restart Stopwatch
This node can be used to restart the stopwatch.
Attribute | Type | Description |
|---|---|---|
Stopwatch | Stopwatch | Requires a Stopwatch component as input, which is provided via the Get node of the Stopwatch component. |
System
This component allows you to retrieve information about your system, such as memory usage, and perform actions, such as restarting the camera. The component itself has no configuration options, but its associated Get node can be used as input for the following nodes:
Section | Tool | Description |
|---|---|---|
Hardware > CPU | ||
Average Load (CPU) | The "Average Load" node provides detailed insights into system performance by outputting the average CPU utilization values for the last 1, 5, and 15 minutes. This node is particularly useful for real-time performance monitoring, identifying trends in CPU usage, or implementing workflows that dynamically respond to system load. | |
Load In Percent (CPU) | The "Load In Percent" node displays CPU utilization as a percentage, providing a clear indicator of system performance. A low percentage generally means the CPU has capacity for additional tasks, while a high percentage indicates heavy CPU utilization that can potentially lead to performance degradation. This data is useful for resource monitoring, trend analysis, and developing workflows that adapt to varying CPU demands. | |
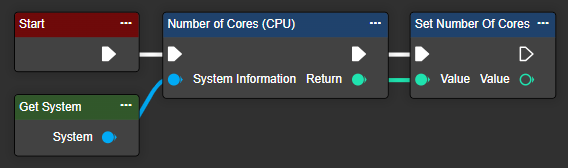
Number of Cores (CPU) | This node allows you to retrieve information about the number of CPU cores in your evoVIU device, providing insight into its hardware configuration. This data is particularly useful for tasks such as optimizing the dashboard or developing workflow logic that adapts to your device's performance. | |
Hardware > Disk | ||
Free Space (Disk) | The "Free Space" value indicates the amount of storage space on your hard drive that is completely free of data. This value is important for monitoring how much storage space is available for new files, applications, or system processes, and for ensuring smooth system operation without storage bottlenecks. | |
Total Space (Disk) | The "Total Space" node displays the total storage capacity of your system hard drive. This is the entire available storage space for data. This information helps you plan your storage usage and optimize your workflows for effective data management. | |
Used Space (Disk) | The "Used Space" node displays the currently occupied storage space on your hard drive. This is the percentage of the total storage space that is used by files, applications, and system data. This information helps you monitor storage usage and optimize workflows to avoid storage bottlenecks.. | |
Used Space in Percent (Disk) | The "Used Space in Percent" node displays the percentage of storage space currently occupied on your system hard drive. This information helps you monitor hard drive usage and manage storage more efficiently to avoid overloading your system. | |
Hardware > Health | ||
Server Boot Time | The Server Boot Time node provides the exact time of your server's last startup or restart. This data is useful for monitoring server availability, checking performance since the last restart, and troubleshooting potential problems. It also helps ensure smooth server operation without unexpected restarts. | |
Uptime | This node provides the exact time since the last system boot or restart. This information is useful for tracking system uptime and monitoring performance since the last boot. It can also be helpful for troubleshooting, system maintenance, and ensuring your device has been running for a reasonable amount of time without unnecessary restarts. | |
Hardware > Memory | ||
Available Memory (RAM) | The "Available Memory (RAM)" node displays the amount of memory available to applications, including unused memory and memory that can be released by the system as needed. It provides insight into the total capacity available for new tasks or processes, helping you monitor system performance and prevent potential memory bottlenecks. | |
Free Memory (RAM) | The "Free Memory" (RAM) node represents the portion of RAM that is completely unused by the system or applications. Unlike available memory, which includes reusable memory, free memory is memory that is not occupied at all. Monitoring this value helps you determine the exact amount of unused resources available for new tasks. | |
Memory in Percent (RAM) | The "Memory in Percent (RAM)" node displays the percentage of your total RAM that is currently in use. A higher percentage means that a large portion of your memory is being used, which can impact performance. This data is valuable for monitoring system load and making adjustments to optimize memory usage. | |
Total Memory (RAM) | The "Total Memory (RAM)" node indicates the total amount of physical memory (RAM) installed in your system. This value represents your system's total RAM capacity, including all memory available to both system processes and applications. It is helpful for understanding your system's overall memory resources, enabling you to assess system performance and plan for memory-intensive workloads. | |
Used Memory (RAM) | The "Used Memory (RAM)" node shows how much memory is currently being used by your system and running applications. This value is helpful for monitoring RAM usage and identifying potential memory bottlenecks or performance issues. | |
Utils | ||
Reboot | This node triggers a restart. Your camera will restart and resume the last active workflow that triggered the restart. | |
Restart | This node triggers a restart. Your camera's servers will restart and resume the last active workflow that triggered the restart. |
Finally, here's a simple example of how you can, among other things, read the number of CPU cores in the workflow:
Timer
The timer can be used as an event within the workflow to trigger nodes at regular intervals specified in milliseconds (ms). Define the desired interval in the component settings under "Utilization."
To use the timer as an event in your workflow, add the "Timer" node from the "Events" menu. All nodes connected to this event will trigger at the specified interval.
Attribute | Type | Description | Example |
|---|---|---|---|
Duty Cycle | Int32 | Specifies the interval at which the event is triggered. The unit used is milliseconds. | 1000 |
Skip Execution Cycle | Boolean | Skip the next scheduled event as long as the current timer flow has not yet completed. The event will only be triggered again in the following cycle. | Possible values:
|
Stop Timer On Error | Boolean | Automatically ends the timer if an error occurs in the associated flow. | Possible values:
|
Detailed information about the timer component can be found here.