Image
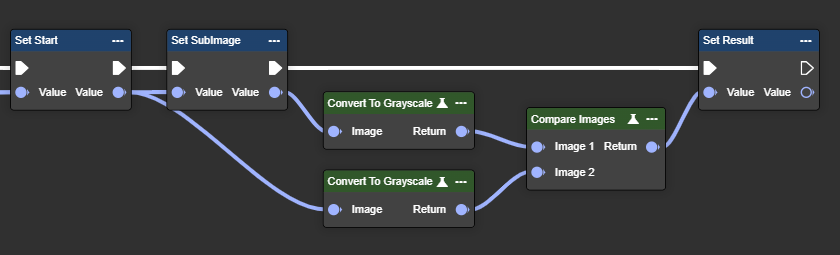
Compare Images
Compares two images and highlights differences – differences appear dark, similarities appear brighter.
Flow
Parameter set
Parameter | Type | Description | Value range | Effect Color | Effect Mono |
|---|---|---|---|---|---|
Image 1 | Image | A grayscale image is required. You can use the "To Grayscale (Image)" node. No color image possible. | 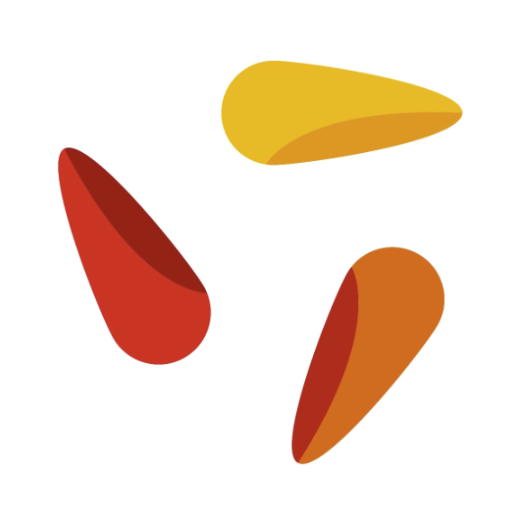 | 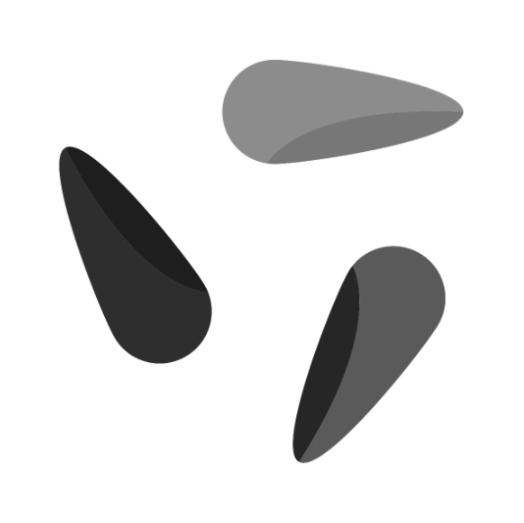 | |
Image 2 | Image | A grayscale image is required. You can use the "To Grayscale (Image)" node. No color image possible. | 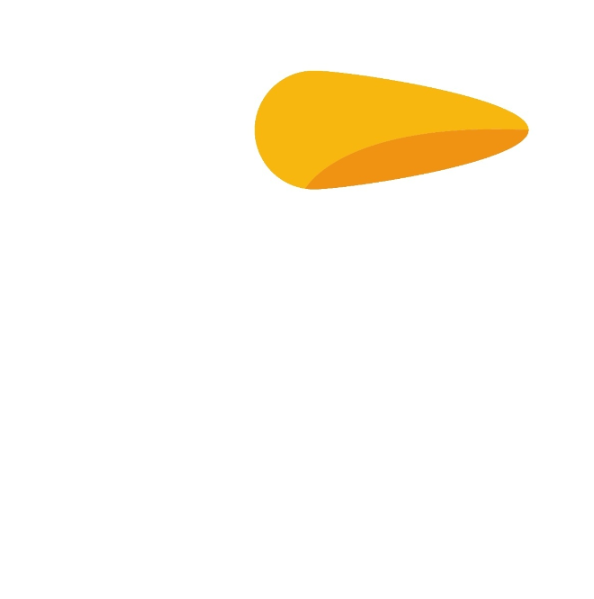 |  | |
Return | Image | The return value is also a grayscale image. |
No result possible. |  |
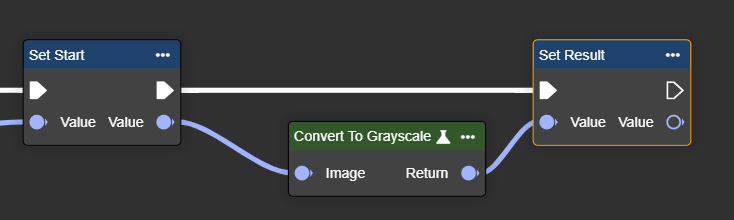
Convert to Grayscale
Converts an RGB image to grayscale based on brightness, simplifying color-independent image processing.
Flow
Parameter set
Parameter | Type | Description | Effect |
|---|---|---|---|
Image | Image | Color image to be converted to grayscale. | |
Return | Image | Converted grayscale image. | |
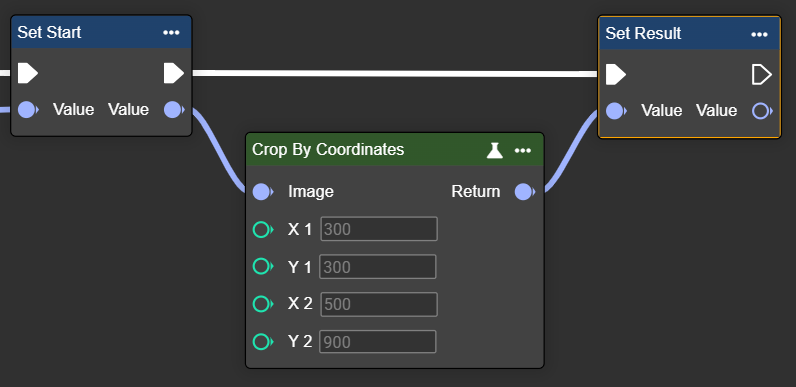
Crop By Coordinates
Crops an image by coordinates – defined by the top left and bottom right corners, extracting the desired area.
Flow
Parameter set
Parameter | Type | Description | Value range | Effect Min | Effect Max |
|---|---|---|---|---|---|
Image | Image | A grayscale or color image is possible. You can use the "Convert To Grayscale" node. | | ||
X1 | Int32 | Coordinates in the image. | X1: 300 X2: 900  | X1: 300 X2: 500  |
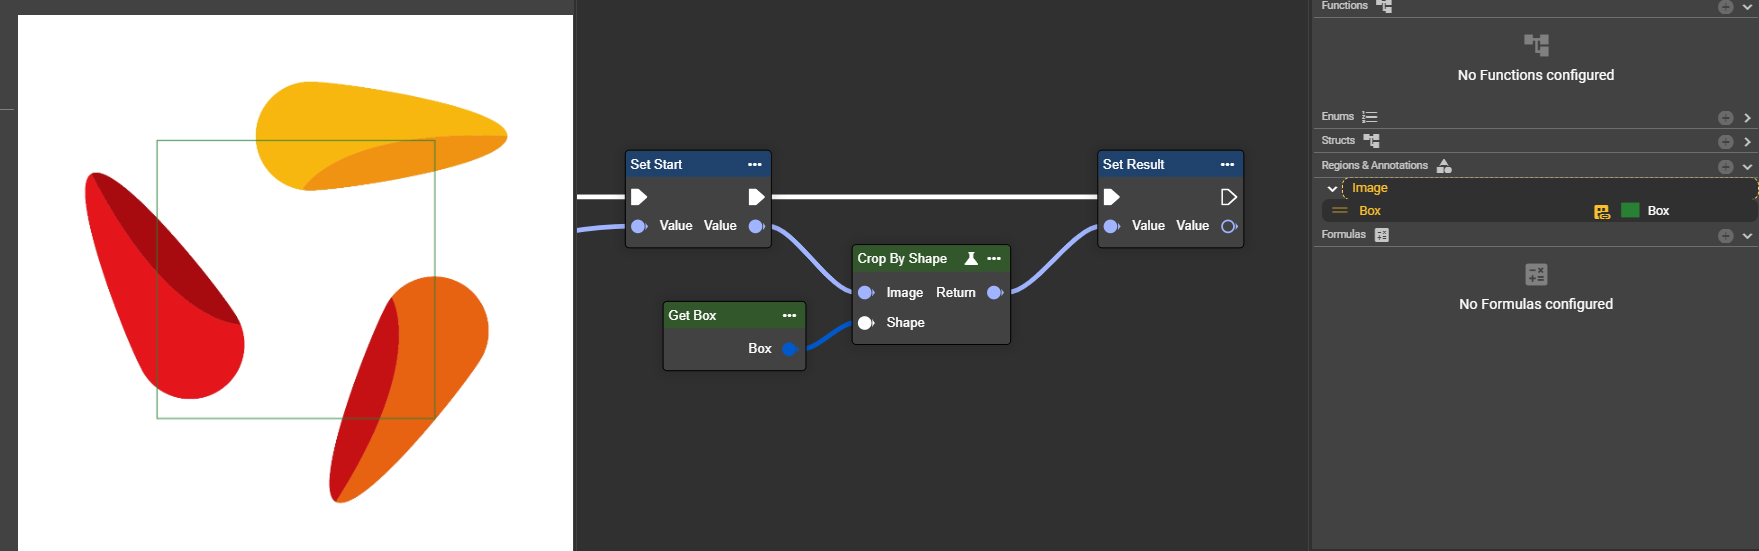
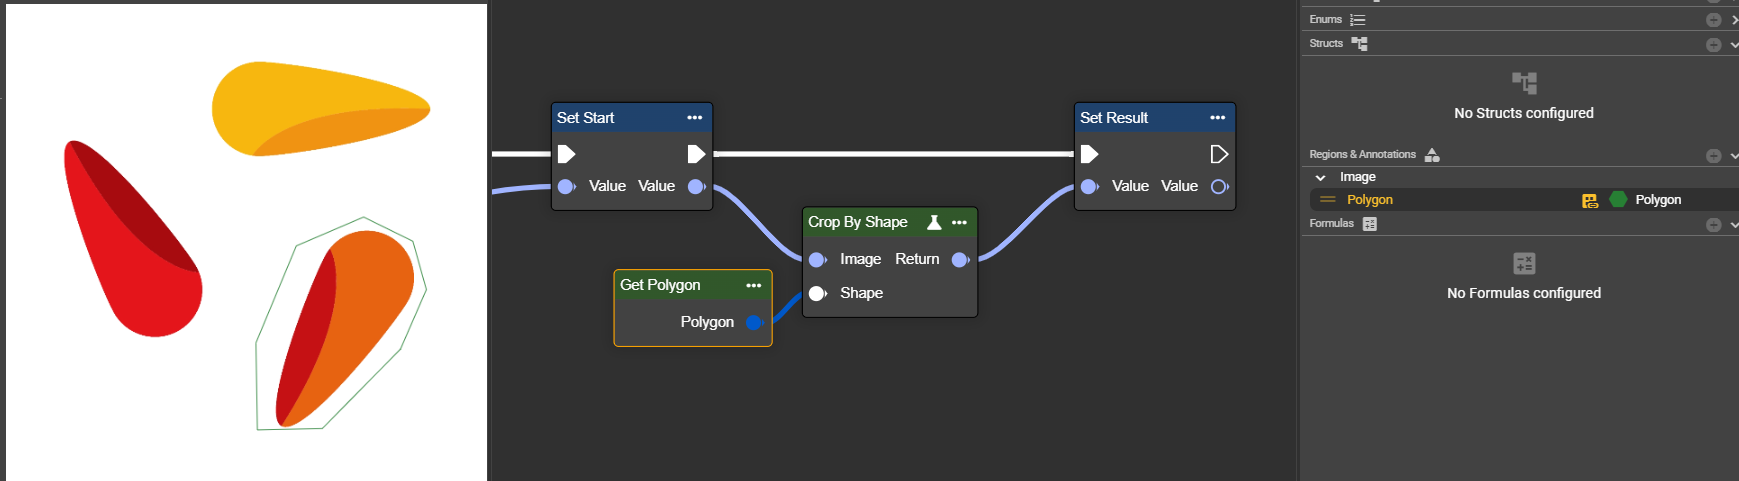
Crop By Shape
Crops an image by coordinates – defined by the top left and bottom right corners, extracting the desired area.
Flow
Example 1: Box
Example 2: Polygon
Parameter set
Parameter | Type | Description | Value range | Effect |
|---|---|---|---|---|
Image | Image | A grayscale or color image is possible. You can use the "Convert To Grayscale" node. | | |
Shape | Shape | The shape used to crop the image. Supported shapes are: box, rectangle, circle, polygon and region. The shapes can come from the annotations in the image editor or be created using Make nodes. | Box | |
Polygon | 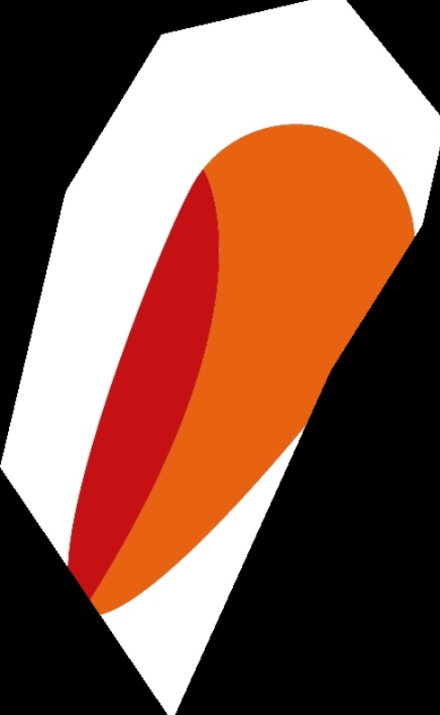 |
Draw Line Variant
Draws a line in the image – useful for marking, highlighting or annotating in image processing tasks.
Flow
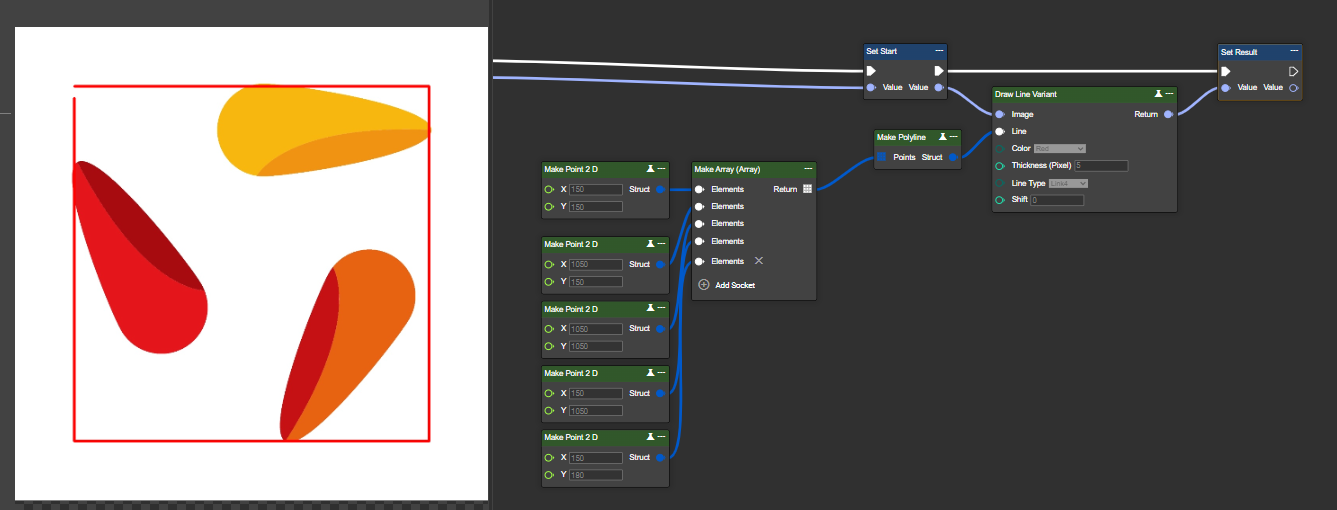
Example 1: Color - Self-generated polyline - any number of points can be defined here.
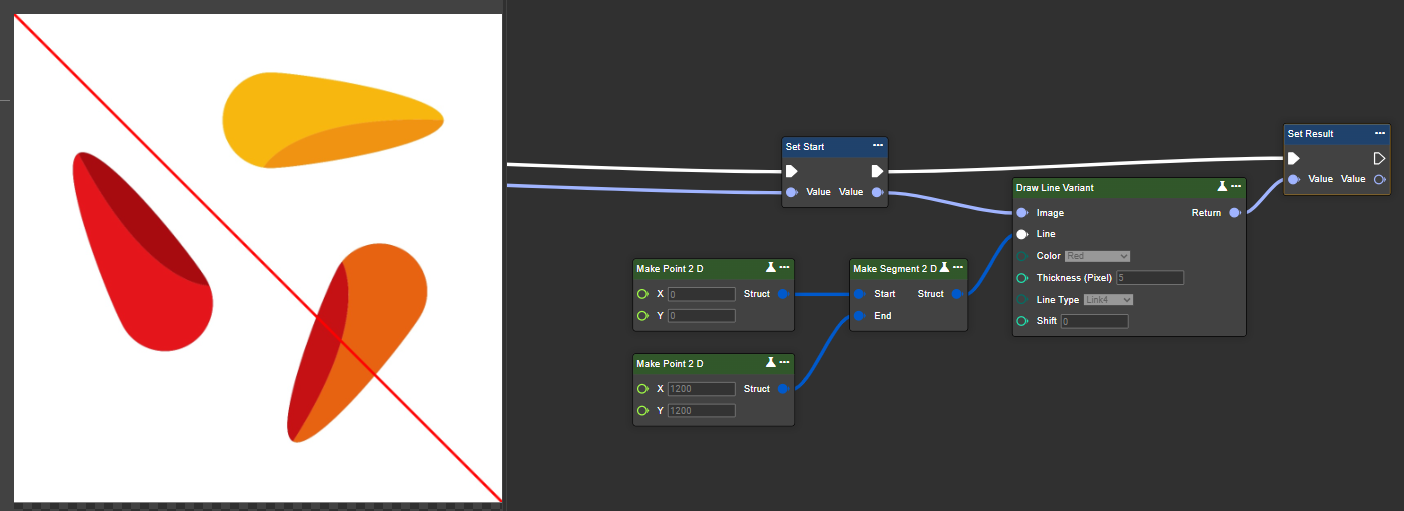
Example 2: Self-generated segment (technically a line) – here, a start and end point are defined for the line.
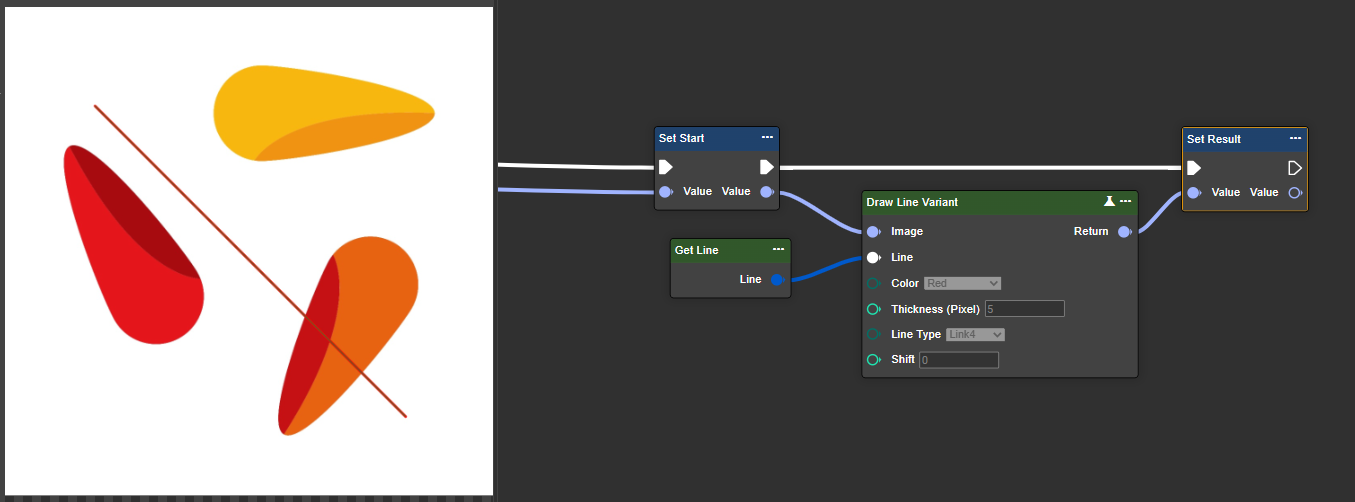
Example 3: A line created and inserted in the image editor.
Parameter set
Parameter | Type | Description | Value range | Effect |
|---|---|---|---|---|
Image | Image | A grayscale or color image is possible. You can use the "Convert To Grayscale" node to convert it to a grayscale image. | | |
Line | Line2D, Segment 2D, Polyline | The supported types are Line2D, Segment2D, and Polyline. The lines can be created manually in the code (Example 1) or imported from the image editor. | Check out example 1, 2, 3 |  |
Color | Enum Color | Adjusts the color of the drawn line. Available colors: Beige, Black, Blue, Green, GreenYellow, Red, White, and Yellow. |  GreenYellow | |
Thickness (Pixel) | Int32 | Adjusts the line thickness in pixels. |  20px | |
Line Type | Enum LineType | Adjusts the line type calculation:
|  Link4  Link 8 | |
Shift | Int32 | Determines the accuracy with which line coordinates are calculated. Higher values enable subpixel accuracy.
Example: If Shift = 2, then the value x = 100.25 is stored internally as x = 401 (100.25 × 2⁴). | |
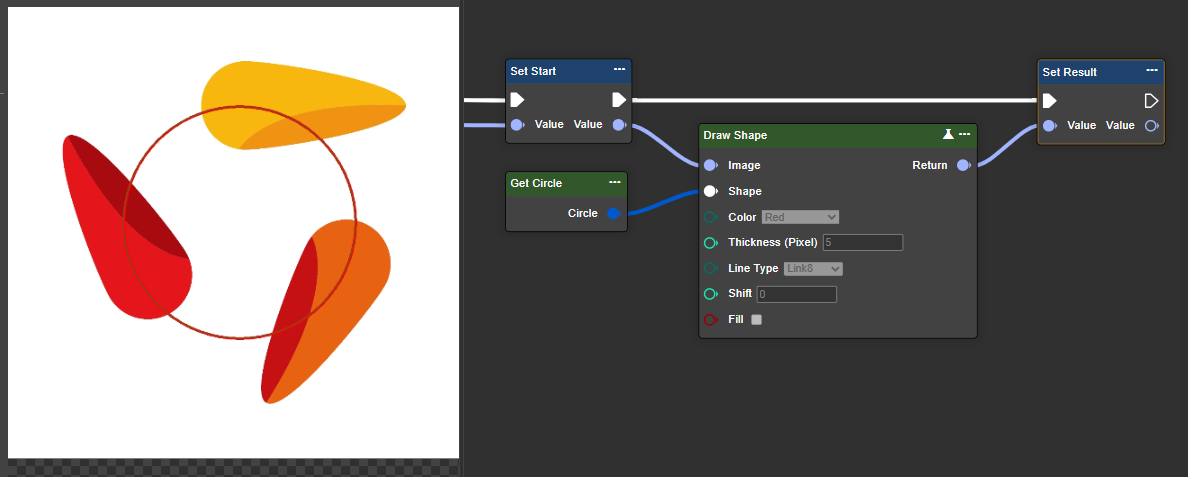
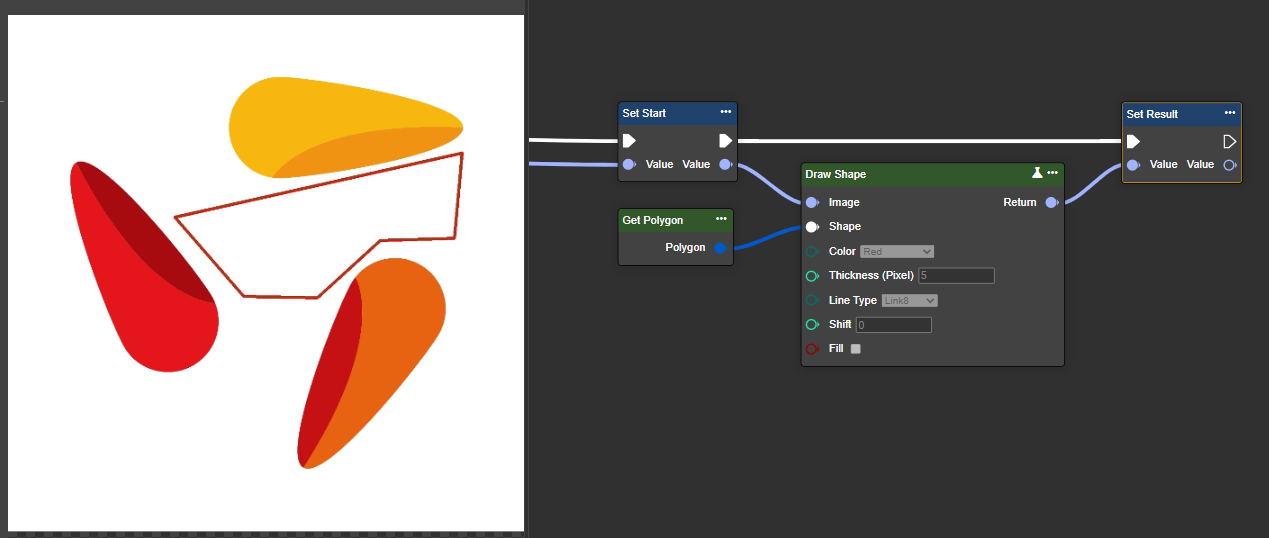
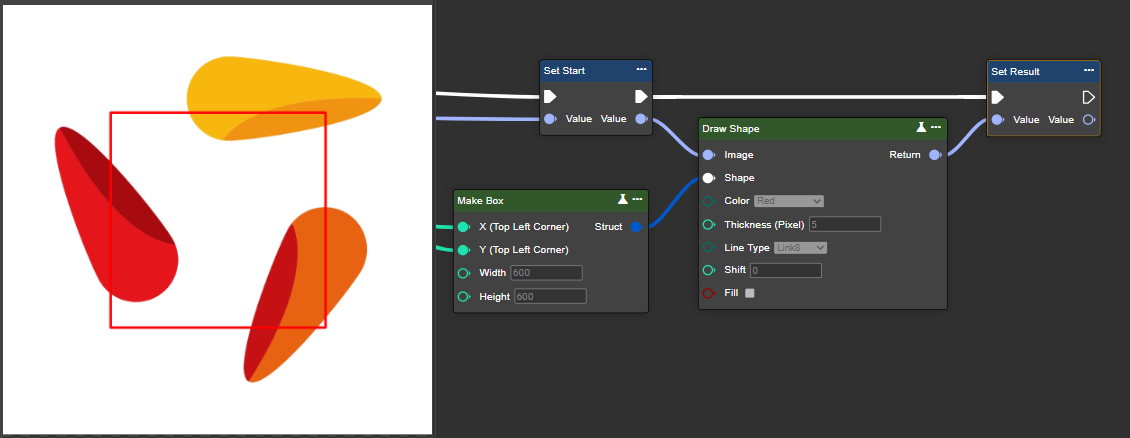
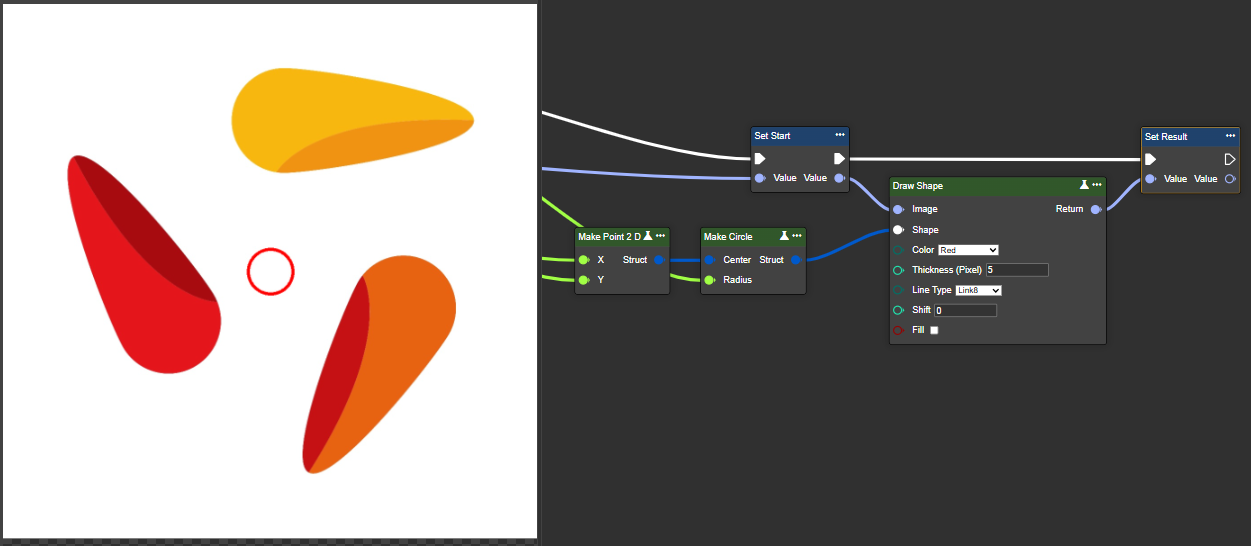
Draw Shape
Allows you to draw shapes in the image – ideal for highlighting or marking specific areas.
Flow
Example 1: Circle from image editor
Example 2: Polygon from image editor
Example 3: Box from calculation in workflow
Example 4: Circle from calculation in workflow
Parameter set
Parameter | Type | Description | Effect |
|---|---|---|---|
Image | Image | A grayscale or color image is possible. You can use the "Convert To Grayscale" node to convert it to a grayscale image. | |
Shape | Circle, Ellipse, Rectangle, Box, Polygon | The supported shapes are ellipse, circle, box, rectangle, and polygon. These shapes can either be created directly in the code (see Example 1) or imported from the image editor. | 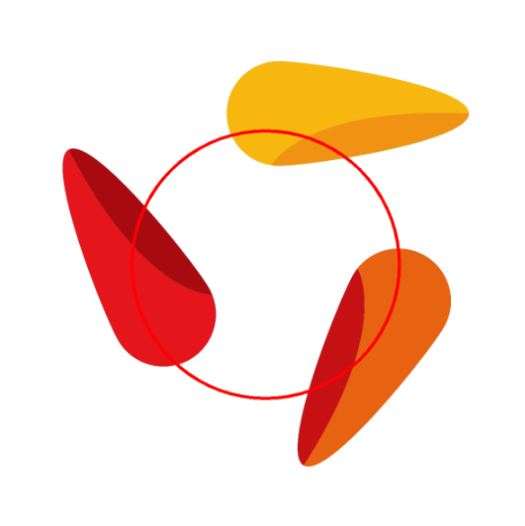 |
Color | Enum Color | Adjusts the color of the drawn line. Available colors: Beige, Black, Blue, Green, GreenYellow, Red, White, and Yellow. | 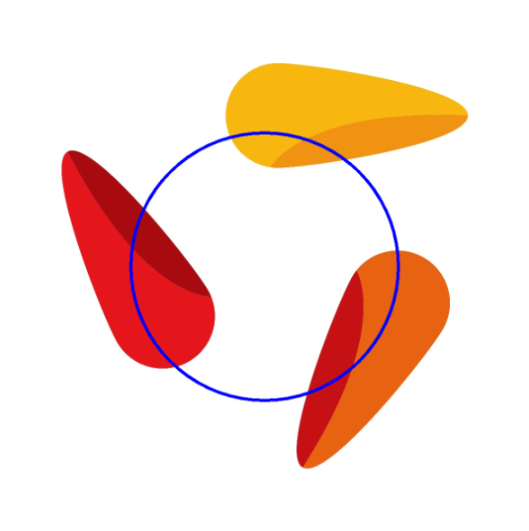 |
Thickness (Pixel) | Int32 | Adjusts the line thickness in pixels. | 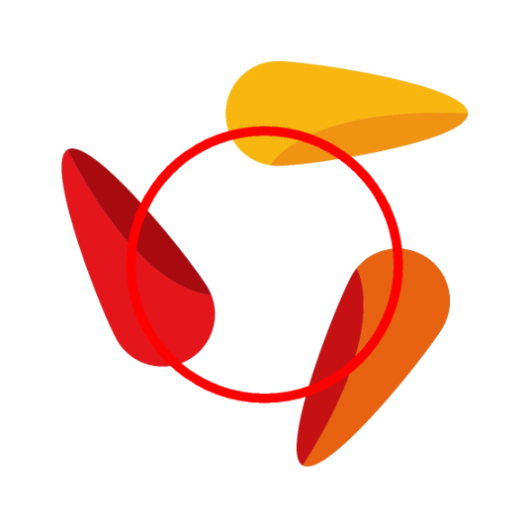 |
Line Type | Enum LineType | Adjusts the line type calculation:
| |
Shift | Int32 | Determines the accuracy with which line coordinates are calculated. Higher values enable subpixel accuracy.
Example: If Shift = 2, then the value x = 100.25 is stored internally as x = 401 (100.25 × 2⁴). | |
Fill | Boolean | Fill the circle completely with the specified color from Color. | 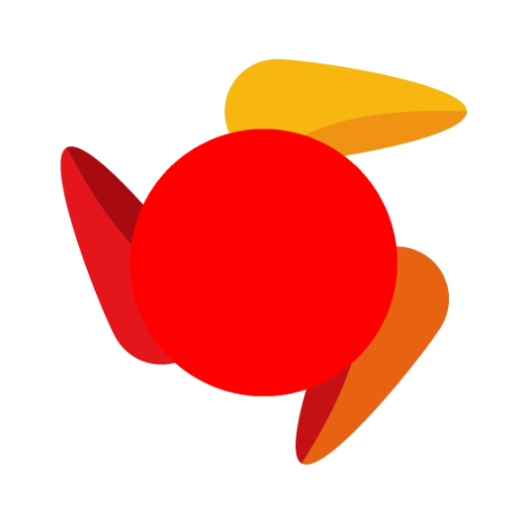 Fill = True |
Draw Ellipse
Draws an ellipse into the image – useful for annotating, highlighting or marking specific image areas.
Ähnlich Draw Shape. Wir empfehlen die Nutzung von Draw Shape
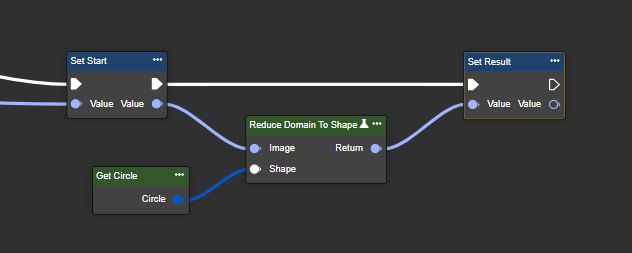
Reduce Domain To Shape
Limits the image area to a shape without cropping – outside pixels become black, coordinates are preserved.
Flow
Example 1 - Creating a shape via image editor
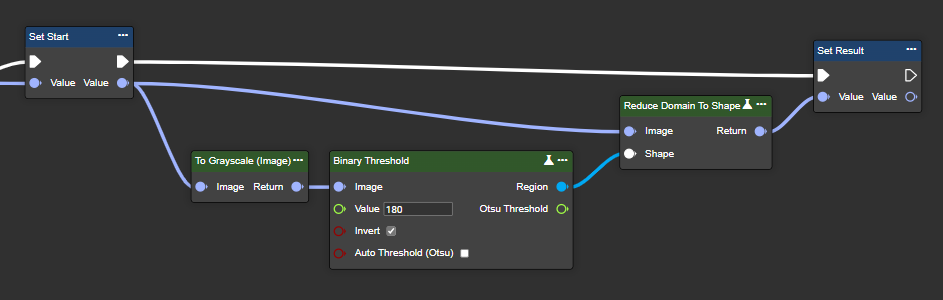
Example 2 - Creating a shape mask by segmenting a grayscale image using binary thresholding (Threshold Binary)
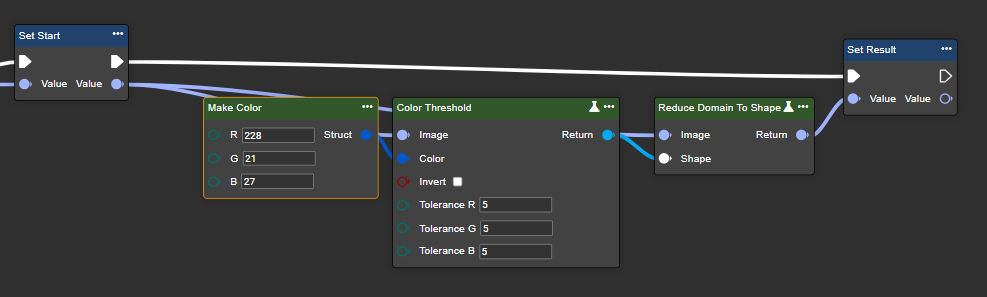
Example 3 - Creating a shape mask by segmentation using color thresholding.
Parameter set
Parameter | Type | Description | Example 1 | Example 2 | Example 3 |
|---|---|---|---|---|---|
Image | Image | A grayscale or color image is possible. You can use the "Convert To Grayscale" node to convert it to a grayscale image. | | ||
Shape | Box, Rectangle, Circle, Polygon, Region | The following shape types are supported: region, circle, box, rectangle, and polygon. Shapes can be created directly in the code or imported from an image editor. Segmentation also allows for the extraction of images. | 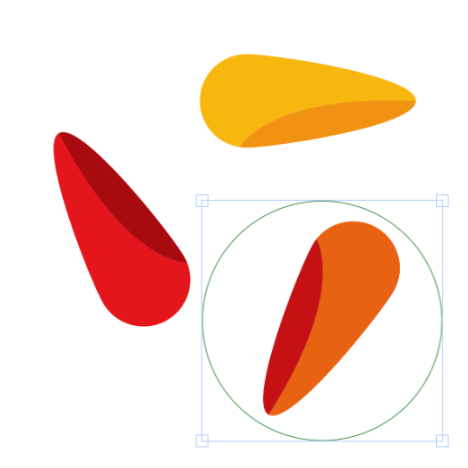 | ||
Return | Image | Return of the image that has been reduced to the shape mask. | 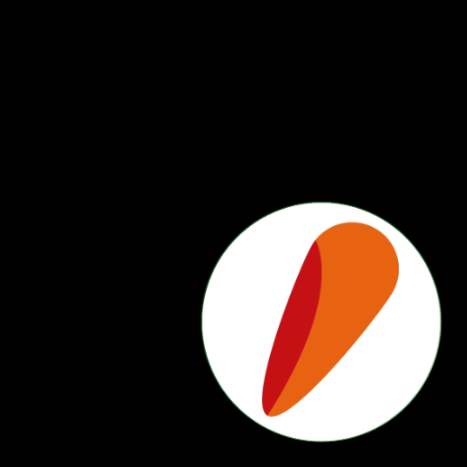 |  | 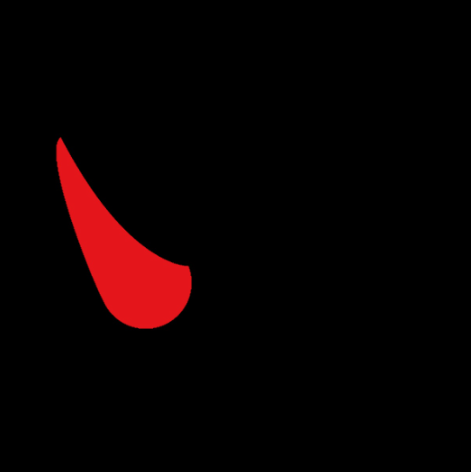 |
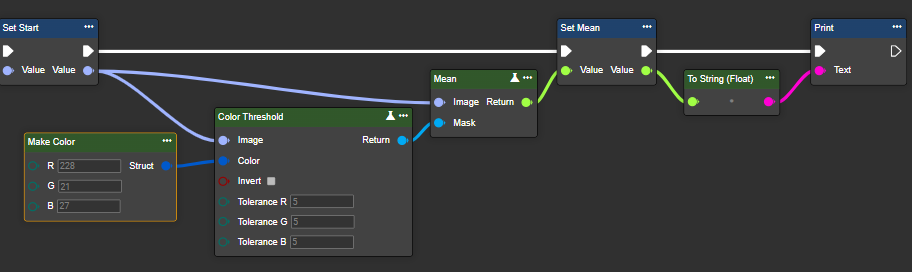
Mean
Calculates the average of all pixels – provides information about average brightness or color intensity in the image.
Flow
Parameter set
Parameter | Type | Description | Effect |
|---|---|---|---|
Image | Image | A grayscale or color image is possible. You can use the "Convert To Grayscale" node to convert it to a grayscale image. | |
Mask | Region - aus Segmentation | Optional binary mask region. If a mask is specified, only pixels within this region are considered when calculating the average. Pixels outside the mask are ignored. | |
Return | Single | Average intensity is displayed. High values indicate that the image is brighter or more intense, while low values indicate a darker or less intense image. |
|
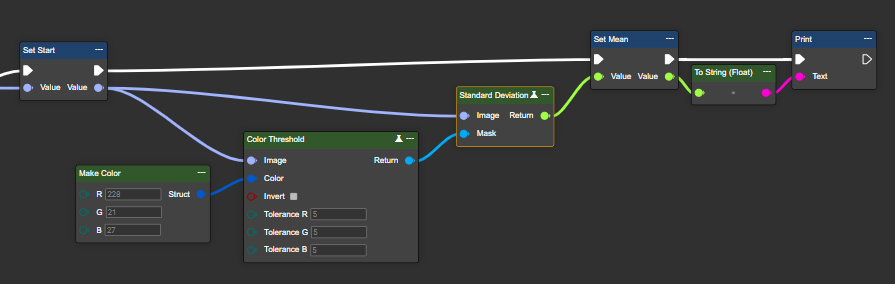
Standard Deviation
Calculates the standard deviation of pixel values – shows how much brightness or color scatters or varies in the image.
Flow
Parameter set
Parameter | Type | Description | Effect |
|---|---|---|---|
Image | Image | A grayscale or color image is possible. You can use the "Convert To Grayscale" node to convert it to a grayscale image. | |
Mask | Region - aus Segmentation | Optional binary mask region. If a mask is specified, only pixels within this region are considered when calculating the average. Pixels outside the mask are ignored. | |
Return | Single | High values indicate greater variability or higher contrast of pixel values, while low values suggest a more even or constant distribution of pixel values. |
|
Minimum
Calculates the standard deviation of pixel values – shows how much brightness or color scatters or varies in the image.
Flow
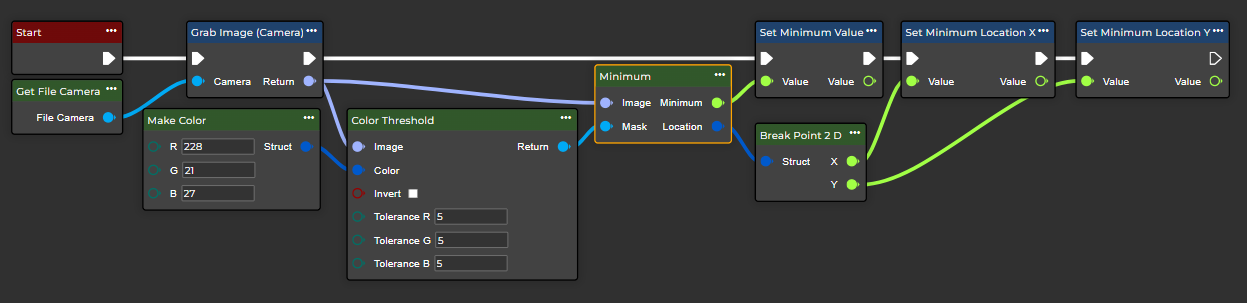
Parameter set
Parameter | Type | Description | Effekt Min | Effekt Max |
|---|---|---|---|---|
Image | Image | A grayscale image is required. You can use the "To Grayscale (Image)" node. | | |
Mask Width (Pixel) | Region | Specify the width of the mask used for deviation calculation. Larger values cover a wider range, which helps in detecting larger or more significant deviations. | Width: 5px 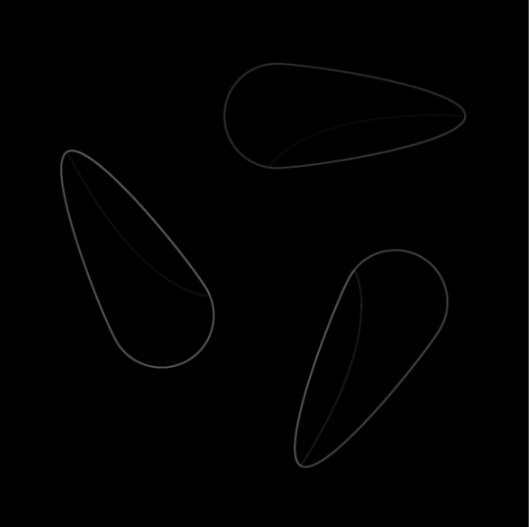 | Width: 200px 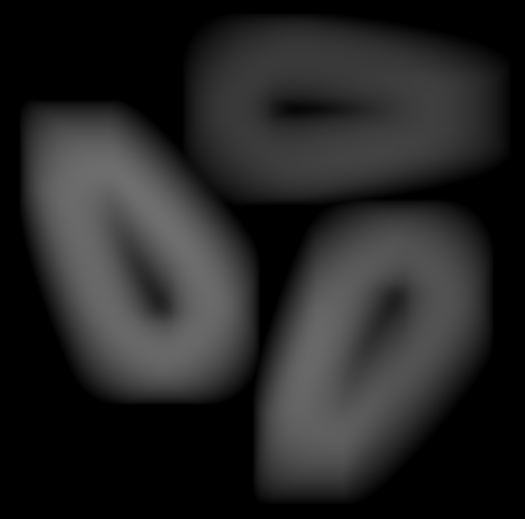 |
Maximum
Determines the highest pixel value in the image – shows the brightest or most intense area in the entire image.
Flow
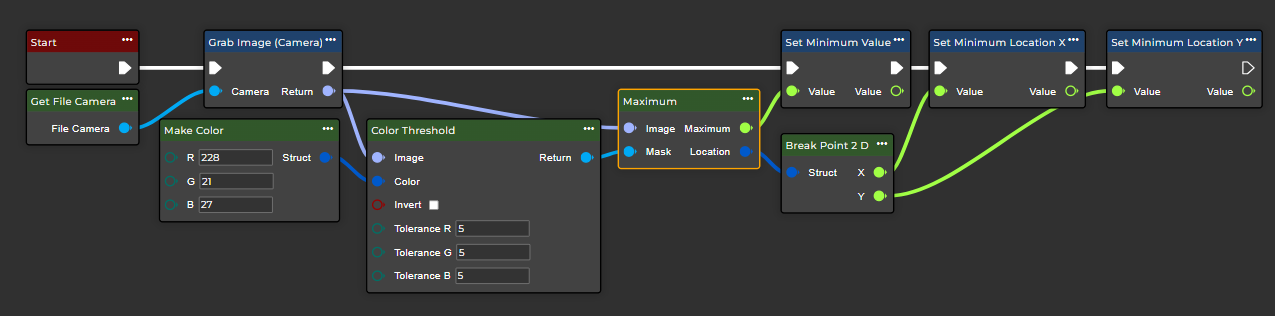
Parameter set
Parameter | Type | Description | Effect Min | Effect Max |
|---|---|---|---|---|
Image | Image | A grayscale image is required. You can use the "To Grayscale (Image)" node. | | |
Mask Width (Pixel) | Int32 | Set the width of the mask used for the deviation calculation. Larger values cover a wider area, helping to detect larger or more significant deviations. | Width: 5px | Width: 200px |
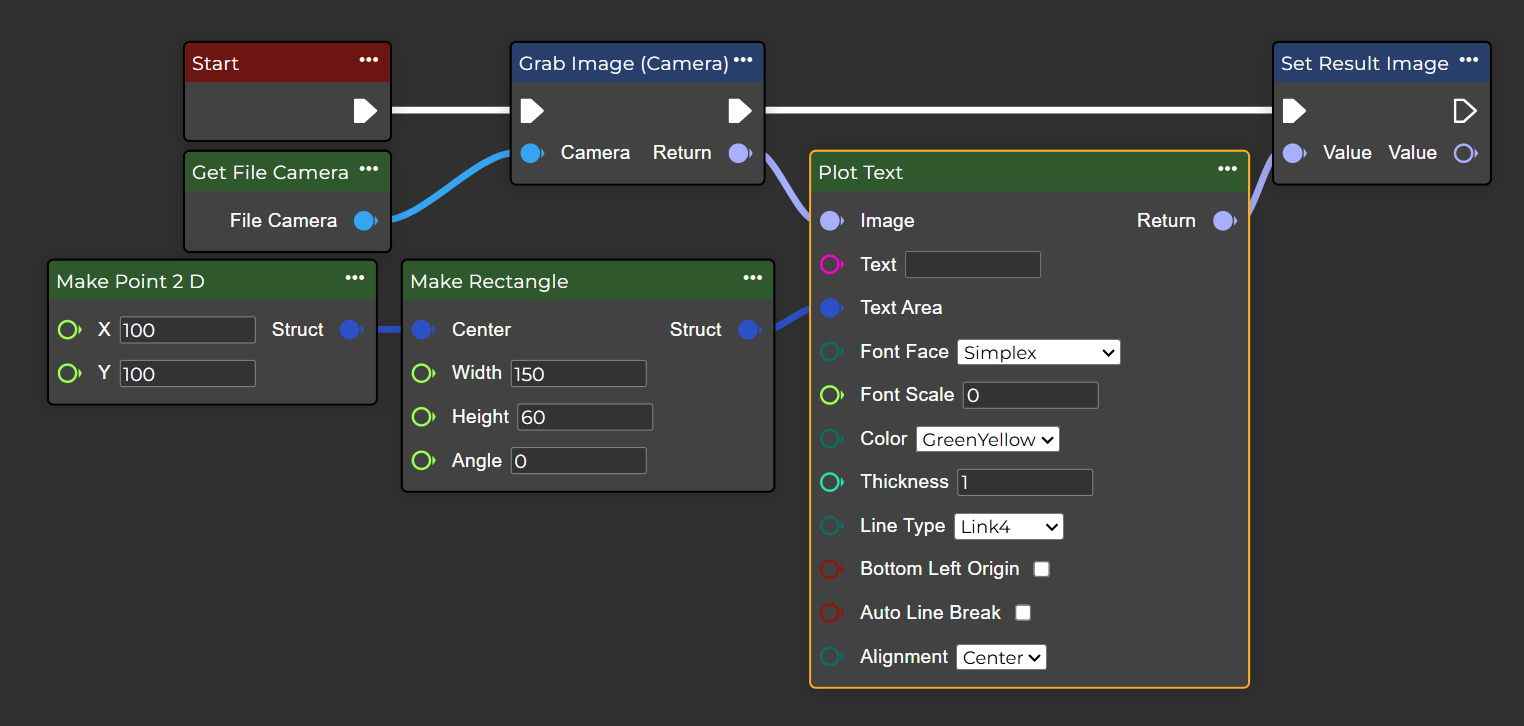
Plot Text
Draws a text at a defined position in the image – non-displayable characters are replaced by question marks.
Flow
Parameter set
Parameter | Type | Description |
|---|---|---|
Image | Image | Enter an image on which the text should be drawn. |
Text | String | The text string to be displayed. |
Text Area | Rectangle | Defines the rectangular area in which the text should be placed. If the text exceeds this area, it will either wrap (if automatic line wrapping is enabled) or be cut off. |
Font Face | Font Type | The font to use. Possible options are:
|
Font Scale | Single | Font scaling factor, which is multiplied by the font-specific base size. |
Color | Color | The font color to be used. Possible options are:
|
Thickness | Int32 | Line thickness of the lines used to draw text. |
Line Type | LineType | The line type to use. |
Bottom Left Origin | Boolean | If this setting is correct, the text will be drawn with the baseline aligned to the bottom left corner. |
Auto Line Break | Boolean | If this option is enabled, the text will automatically wrap to multiple lines if it exceeds the width of the text area. If it is disabled, the text will be displayed on a single line and may overflow. |
Alignment | TextAlign | Sets the text alignment within the textArea. The text will be left-aligned within the textArea. The text will be centered within the textArea. The text will be right-aligned within the textArea. |
Return | Image | Image with text superimposed. |
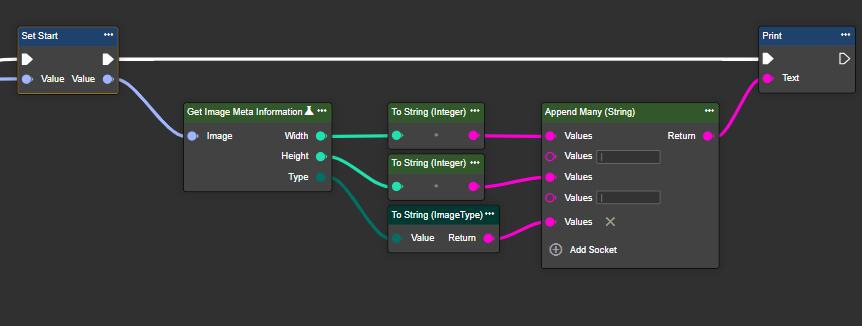
Get Image Meta Information
Returns metadata for the input image – determines image type, width and height.
Flow
Parameter set
Parameter | Type | Description |
|---|---|---|
Image | Image | A grayscale image is required. You can use the "To Grayscale (Image)" node. |
Width | Int32 | The width of the image. |
Height | Int32 | The height of the image. |
Type | ImageType | Indicates whether the image is in color or grayscale. |
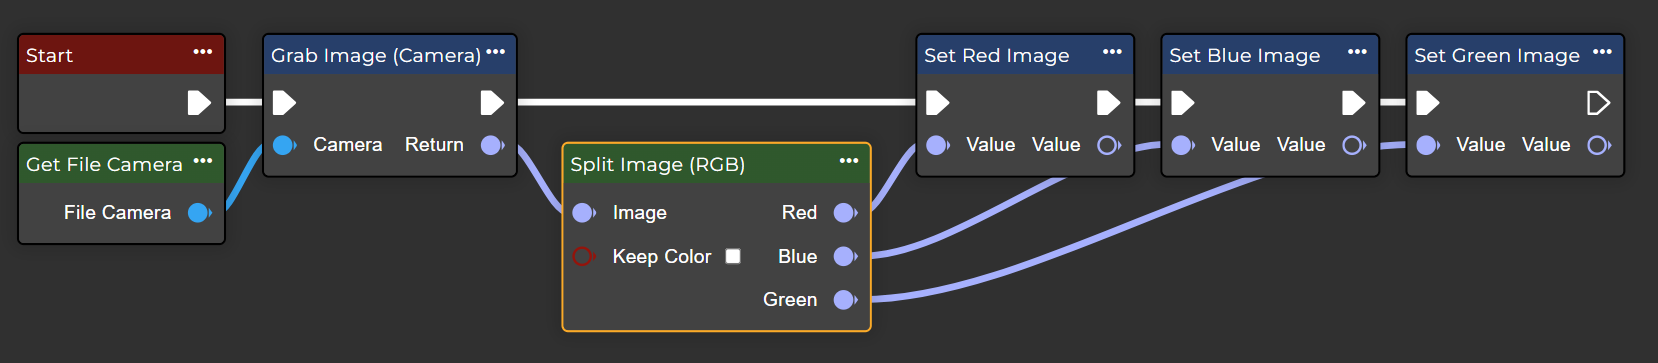
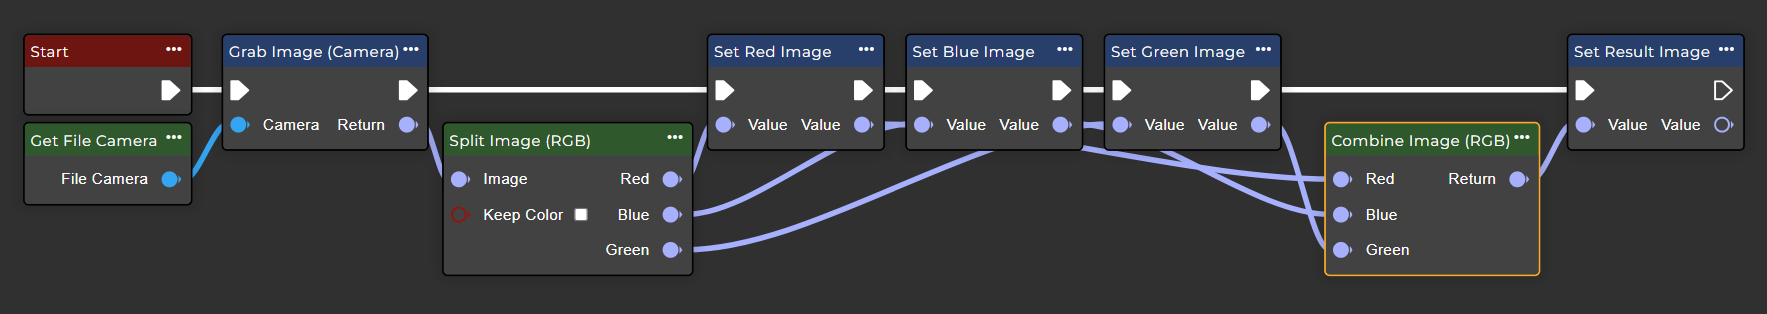
Split Image (RGB)
Determines the RGB color channels of an image - returns one value for each channel.
Flow
Parameter set
Parameter | Type | Description |
|---|---|---|
Image | Image | The color image on which the operation is to be applied. |
Keep Color | Boolean | Retains the channel's color in the new image. |
Red | Image | The original image is based on the red color channel. |
Blue | Image | The original image is based on the blue color channel. |
Green | Image | The original image is based on the green color channel. |
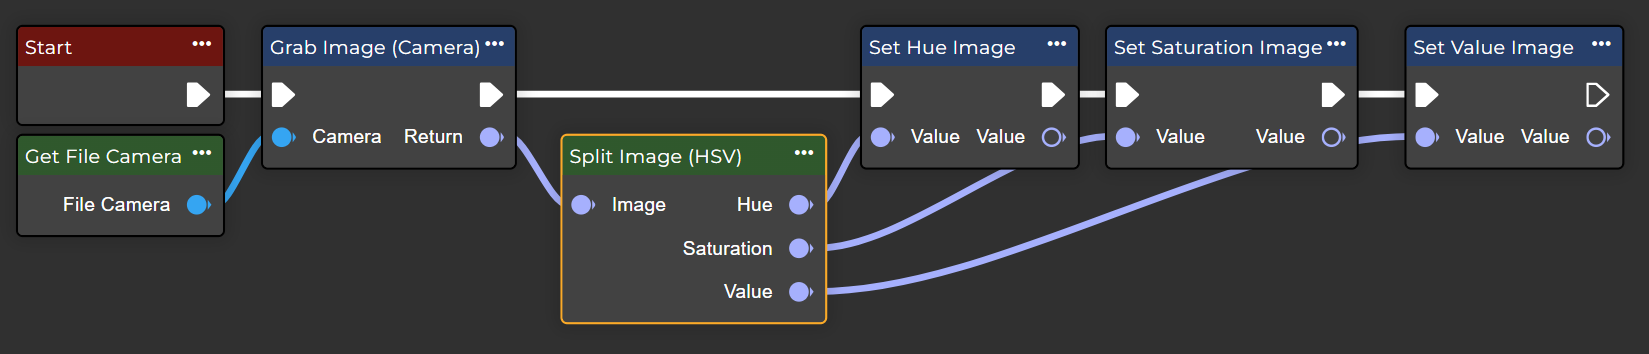
Split Image (HSV)
Determines the hue, saturation, and brightness of an RGB image by converting to HSV color space and splitting the channels.
Flow
Parameter set
Parameter | Type | Description |
|---|---|---|
Image | Image | The color image on which the operation is to be applied. |
Hue | Image | Image of the hue channel. |
Saturation | Image | Image of the saturation channel. |
Value | Image | Image of the brightness channel |
Combine Image
Creates a color image by combining individual images for red, green, and blue channels.
Flow
Parameter set
Parameter | Type | Description |
|---|---|---|
Red | Image | The input image is based on the red color channel. |
Blue | Image | The input image is based on the blue color channel. |
Green | Image | The input image is based on the greencolor channel. |
Return | Image | The original image is based on the combination of the three images with their respective color channels. |
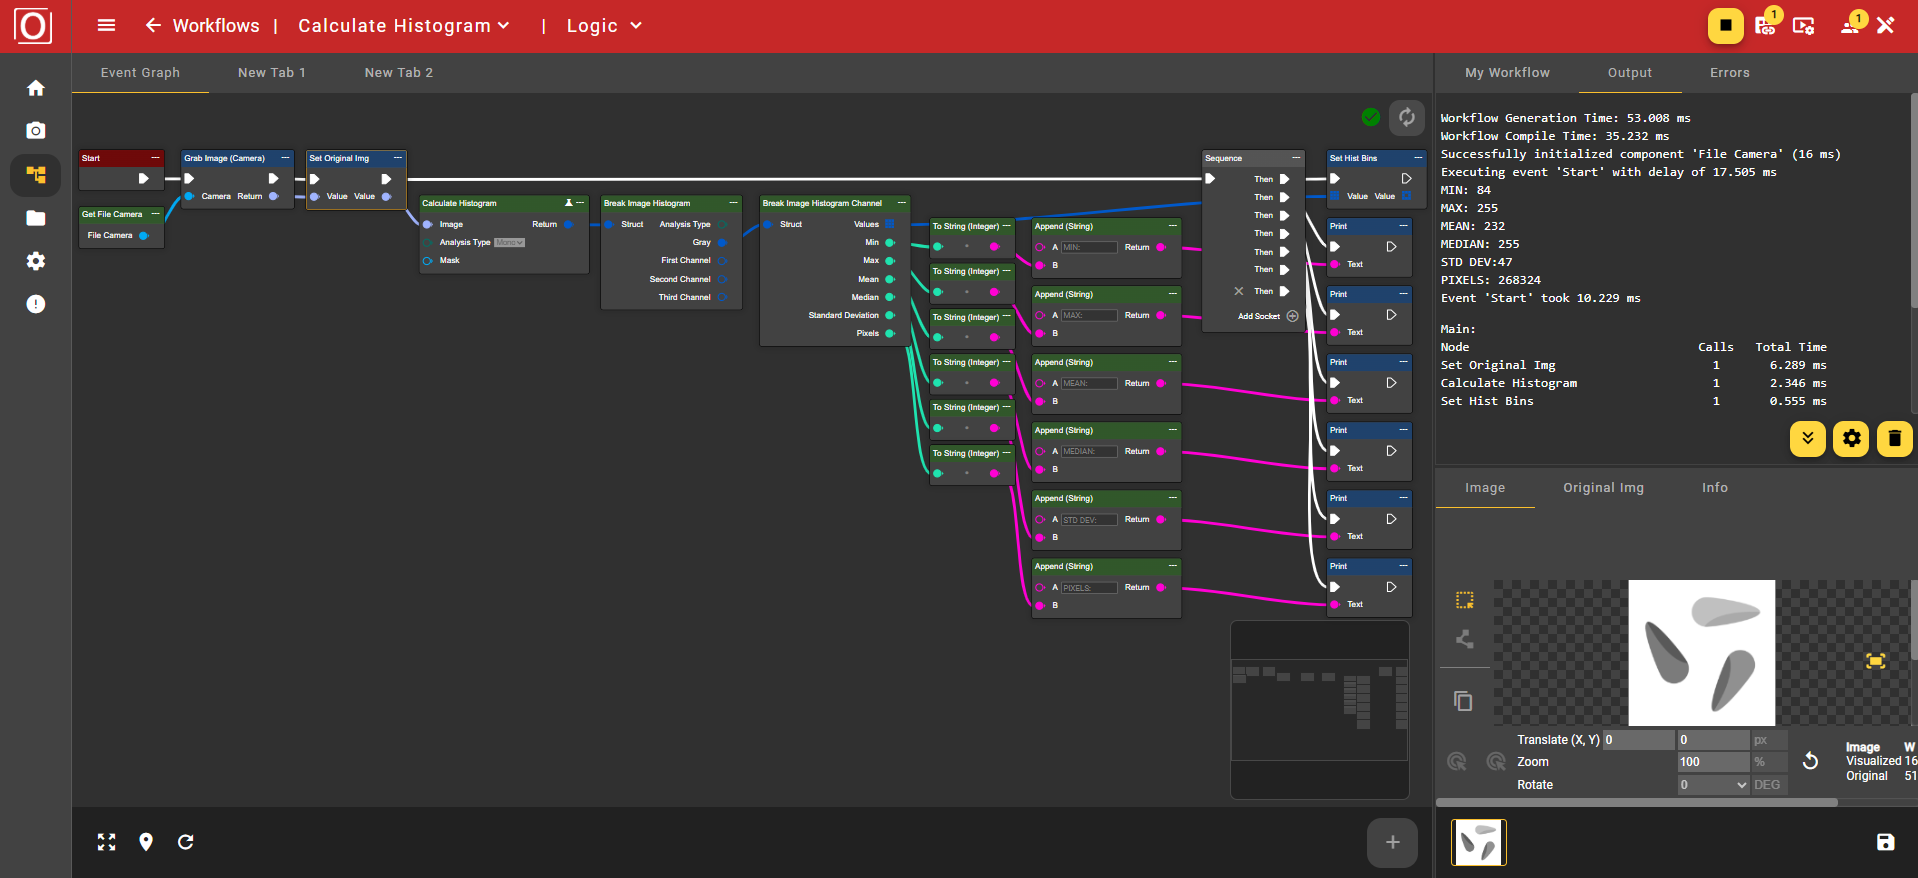
Calculate Histogram
Calculates the histogram of an image. Supports grayscale (mono), RGB, and HSV channels. Optionally, a mask can be provided to calculate the histogram only for selected areas.
Flow
Parameter set
Attribute | Type | Description | Value range | Effect | ||||||||||||||
|---|---|---|---|---|---|---|---|---|---|---|---|---|---|---|---|---|---|---|
Image | Image | Input image, on which the histogram calculation is performed. | | |||||||||||||||
Analysis Type | HistogramAnalysisType | Histogram channel mode to use:
| Mono |
| ||||||||||||||
Histogram channel mode to use:
| RGB |
| ||||||||||||||||
Histogram channel mode to use:
| HSV |
| ||||||||||||||||
Mask | Region | Optional image area to include in the histogram. Only pixels within this area are considered. If set to zero, the histogram is calculated across the entire image. | ||||||||||||||||
Return | Image Histogram | Returns the calculation results as a structure. A detailed breakdown can be performed using the Break Image Histogram function. |
The histogram data can be further processed using the Break Histogram node. This node decomposes the structure into its individual components. Depending on the previously selected Analysis Type, the results of the histogram calculation can be read via the Gray outputs if Mono was previously selected, or First Channel, Second Channel, and Third Channel if RGB or HSV was used.
If the respective channels are further broken down using Break Image Histogram Channel, one obtains, on the one hand, an array of tuples consisting of the value and its frequency, and on the other hand, the extreme values already listed above in the table.